Free & open source · MIT · Windows · Linux · macOS
Know which machine is faster — and why.
loadbearer benchmarks a machine's CPU, memory, disk and
network stack — and its GPU where there is one — scores every measurement
against a shared reference baseline, and grades each component and the
whole machine on an S‑to‑F scale. Point it at two laptops and
it tells you which one wins, by how much, and what's holding the other
back. A sustained‑load test shows how much speed each one keeps
once it heats up.
Latest release — ·
one self-contained binary · no runtime, no network access
loadbearer run
loadbearer 1.2.2 — assessment
Machine ThinkPad-X280 · i5-8350U · 8 threads · 7.0 GiB RAM
Profile general · curve k=0.5 · baseline reference-v1
Clocks 3.4→3.4 GHz (min 3.3) · steady
CPU 984 [B]████████████████░░░░░░░
Integer, all cores 25180.3 Mops/s 1.43x 1194 high
Float, all cores 36997.5 MFLOP/s 1.61x 1267 high
BLAKE3 hash 2384.6 MiB/s 1.27x 1128 high
informational Integer, 4 threads 24880 Mops/s
MEMORY 947 [B]███████████████░░░░░░░░
Sequential read 8.9 GiB/s 0.83x 913 medium
Random access latency 181.8 ns 0.81x 901 high
informational ~L1 1.1 ns · ~L2 3.4 ns · ~L3 14.9 ns
DISK 835 [C]█████████████░░░░░░░░░░
Sequential read 380.4 MiB/s 0.67x 816 high
Random 4K write 7601.6 IOPS 0.70x 838 low
informational Random 4K read, deep queue 61044 IOPS
NETWORK 1219 [A]████████████████████░░· not in overall
TCP round-trip latency 54.6 us 0.73x 853 low
UDP send rate 169.1 Kpps 1.82x 1348 high
OVERALL 920 [B]███████████████░░░░░░░
Why:
- held back by Disk (score 835)
- low measurement confidence in: Disk
vs typical hardware · not graded
CPU -1% CPU matches a typical Intel Core i5-8350U
int_multi +0% · float_multi +0% · hash +0% · aes_gcm -4% · sha256 -2% · …
What it does
A benchmark that answers a question, not just prints numbers
Raw MiB/s and Mops/s don't tell you whether laptop A beats laptop B.
loadbearer turns them into a grade, a verdict, and a reason.
One graded answer per machine
CPU, memory, disk and network each get a score against the baseline
(1000 = the mean of a small fleet of real machines) and a letter grade.
A profile-weighted
geometric mean of CPU, memory and disk becomes one overall grade,
with a plain-language note on what moved it. Network, the GPU (FP32 +
VRAM bandwidth, via OpenCL), battery health, and the sustained-load test
are shown alongside — OS, optional hardware, wear, cooling — so they
don't skew the grade. When the CPU or GPU model is in the reference
table, a vs typical hardware line says whether it's performing to
spec for its model — also ungraded.
Head-to-head, in one sentence
loadbearer compare a.json b.json reads the raw metrics
from two runs and says: "dev-desktop leads by 68% overall (ahead on
cpu +90%, memory +55%)." Baseline-independent, so it holds even
across tool versions — and loadbearer score re-grades an old
run against a new baseline without re-running it.
A method you can check
Fixed-time throughput measurement, medians with confidence flags
from run-to-run spread, geometric means throughout, and a documented
baseline you can regenerate from your own hardware. No hidden weighting —
it's a few constants in the source.
Honest and self-contained
One static binary, no runtime. No network calls — the network test is
loopback only. Disk reads bypass the OS page cache
(O_DIRECT / FILE_FLAG_NO_BUFFERING). Workloads
are reproducible with --seed.
See it
The whole thing is a terminal
An interactive run shows a live TUI, and compare
opens a scrollable coloured view; piped or scripted, both fall back to
plain text or JSON. info, soak and
mem are plain diagnostics. Here's the plain output.
loadbearer compare x280.json desktop.json --plain
loadbearer 1.2.2 — compare (2 machines)

  A  ThinkPad-X280   Intel(R) Core(TM) i5-8350U
  B  dev-desktop     AMD Ryzen 9 7900X

  metric                          A: ThinkPad-X2…  B: dev-desktop
  CPU
  Integer, all cores (Mops/s)             37305   70879 +90%  B
  BLAKE3 hash (MiB/s)                       3563    6769 +90%  B
    → component                              ref         +90%  B
  MEMORY
  Sequential read (GiB/s)                   13.1    20.2 +55%  B
  Random access latency (ns)              136.7    88.2 +55%  B
    → component                              ref         +55%  B
  NETWORK
  TCP round-trip latency (us)               19.8    12.4 +60%  B
    → component                              ref         +60%  B

  OVERALL                                    ref         +68%  B

  Verdict: dev-desktop leads by 68% overall
           (ahead on cpu +90%, memory +55%, network +60%).
loadbearer run · live
loadbearer — running elapsed 0:41
CPU
Integer, single-core ██████████ done 9153 Mops/s ✓
Integer, all cores ██████████ done 36932 Mops/s ✓
Float, single-core ██████░░░░ 3/5 7101 MFLOP/s
Float, all cores ░░░░░░░░░░
Memory
Sequential read ░░░░░░░░░░
Disk
Sequential write ░░░░░░░░░░████████░░░░░░░░░░░░░░░ 38% · elapsed 0:41 · eta 1:06
q quit
loadbearer info
loadbearer 1.2.2 — machine inventory

Host
  Hostname        ThinkPad-X280
  OS              Linux (Ubuntu 26.04)
  Architecture    x86_64

CPU
  Model           Intel(R) Core(TM) i5-8350U CPU @ 1.70GHz
  Cores           4 physical / 8 logical

Memory
  RAM             7.0 GiB

Battery
  Charge          78% (discharging)
  Health          42.0 / 48.0 Wh design (88%)
  Cycles          257

Disks
  /               ext4   SSD   232.6 GiB total,  47.3 GiB free
loadbearer soak
  SOAK      90s · 8 threads · not graded
    Peak               19140 Mops/s   (2–5s)
    Steady             17620 Mops/s   (68–90s)   92.1% retained
    Throttle     onset ~14s (drop below 95% of peak)
    Stability    steady-window CV 1.6%
    Clock        3.60 GHz peak → 3.28 GHz steady
    Trace        ██▇█████▇▇▇▆▆▅▅▄▄▄▄▄▄  (≈1s/mark)
    → throttles from ~14s; settles at 92% of peak
$ loadbearer run # grade this machine (TUI)$ loadbearer run --output me.json # ...and save the result$ loadbearer compare me.json them.json # which machine wins, and why$ loadbearer soak # does it throttle under a long load?$ loadbearer mem # what's using RAM (ps_mem-style, PSS)$ loadbearer score me.json --baseline ref.toml # re-grade, no re-run$ loadbearer run --json | jq .overall # for scripts and CI gates$ loadbearer run --only cpu,memory # skip the disk write$ loadbearer baseline runs/*.json > ref.toml # recalibrate to your fleet
Profiles (--profile dev-workstation, content-creation,
server) reweight the components for a workload.
loadbearer run --soak folds the sustained-load test into a full
assessment. A real link test between two machines:
loadbearer net-server on one,
loadbearer run --net-target HOST:PORT on the other.
Every run writes a plain-text diagnostic log (--log-file,
--no-log, --log-level) for after-the-fact
troubleshooting.
Install
Install it, download a binary, or build it
Every tagged release ships a self-contained loadbearer.exe
for Windows and a Linux tarball, built from
the same source by CI,
and is published to winget and the Ubuntu PPA.
macOS on Apple Silicon builds and runs from that same source.
🪟 Windows (x86-64)
Install from the Windows Package Manager, which puts
loadbearer on your PATH:
winget install Issinoho.Loadbearer
Or unzip the release and run loadbearer.exe from a
terminal. Releases are Authenticode-signed with a Certum Open Source Code
Signing certificate, applied by hand shortly after each release
publishes — so a build can be briefly unsigned right after tagging;
check with Get-AuthenticodeSignature. An unsigned build
gets a SmartScreen prompt (More info → Run anyway) and is
blocked outright by Smart App Control — run it on a machine without
SAC, or build from source. Every release also publishes a
build-provenance attestation and SHA256SUMS.
No pre-built binary yet — build from source with the same command.
All five components work, GPU via Apple's OpenCL framework. The CPU
aes_gcm / sha256 figures read low (no Arm
crypto instructions in the build) and disk I/O is buffered, both noted
in the result.
Needs a recent stable Rust toolchain. On x86, for CPU kernels that
use your machine's widest vectors (on Apple Silicon a plain release
build is already native):
Full flag reference is in the
README; the
wiki is the deep
dive — every benchmark kernel, the scoring maths worked through,
compare internals, and recalibrating the baseline.
Verifying a download: Windows releases are signed by hand shortly
after publishing (a Certum Open Source Code Signing certificate — check
with Get-AuthenticodeSignature), and every release also
carries a build-provenance attestation, a GPG-signed
SHA256SUMS, and the checksums themselves —
CODE_SIGNING_POLICY.md.
At fleet scale
Now do it for every machine you own
loadbearer-fleet is a companion server. Point it at the
folder your deployment tool drops result files into and it indexes them and
reports across the estate — summary, peer groups, drilldown, and the red
flags worth acting on. Separate repository, separate release, also MIT.
Early, but usable.
http://127.0.0.1:8787
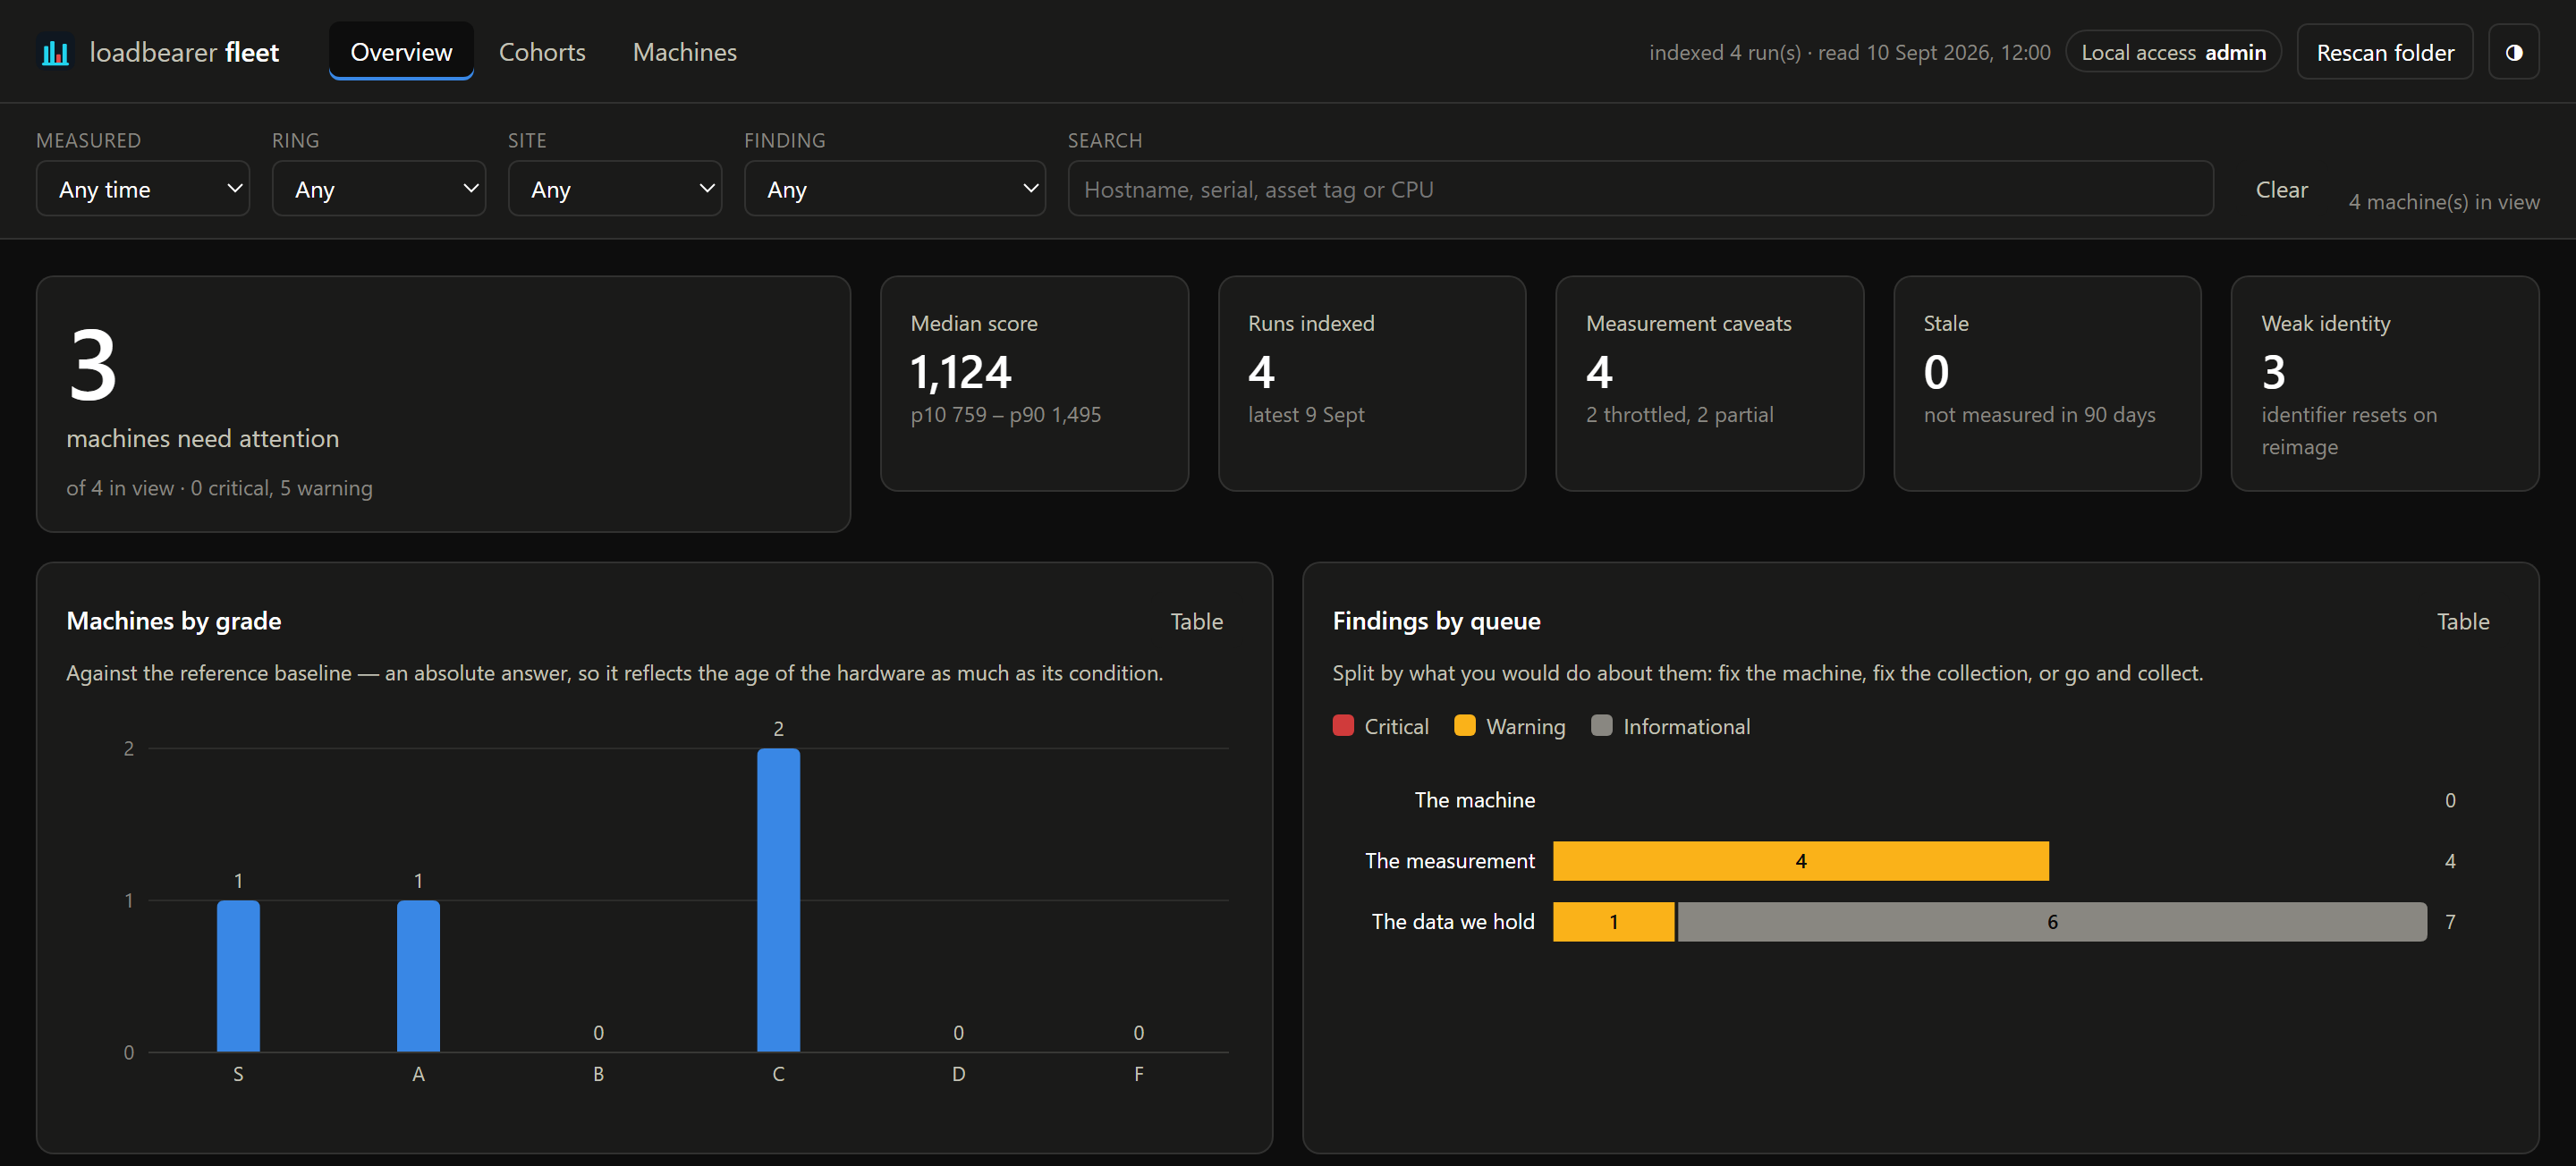
The overview, over that project's four sample results — which is why nothing
has a peer group here: a cohort needs four machines of the same hardware
measured the same way.
Peers first, not the baseline
The reference baseline answers is this machine any good. It's the
wrong tool for is this machine broken — a 15% shortfall against it
could be the baseline. So the primary comparison is a machine against the
machines like it, and the secondary one against its own history, where the
hardware is held constant. Cohorts use median and MAD rather than mean
and standard deviation, because the statistic has to survive the thing it's
looking for.
Three queues, not one wall of red
Findings are split by what you'd do about them: the machine
(repair, replace, reassign), the measurement (the number can't be
trusted until collection is fixed — thermally limited, on battery, a partial
run), and the data we hold (stale, or attributed by an identifier that
resets on reimage). Mixing them means an estate owner reads a thermal caveat
as a failing asset.
Loopback by default, SSO when you need it
Out of the box it serves 127.0.0.1:8787 with no sign-in, and
refuses a wider bind unless sign-in is configured and the public URL is
https — or you pass a flag that says you meant it. Point it at an identity
provider and it does OpenID Connect with PKCE,
roles from group claims and per-site scoping — enforced in the data layer, so
a scoped viewer can't widen their own scope through a query string.
One binary on an air-gapped network
The HTML, CSS and hand-rolled SVG charts are compiled into the executable.
No npm, no bundler, nothing fetched at runtime — which is what lets it send
default-src 'self' and mean it, and what makes it work on a
management network with no route out. Runs as a Windows service or under
systemd, and exports Prometheus metrics.
bash
$ loadbearer-fleet serve \\fileserver\loadbearer # scan, then the dashboard$ loadbearer-fleet report # the same thing, as text$ loadbearer-fleet report --json # the whole snapshot, as the UI sees it$ loadbearer-fleet backup fleet-2026-09-10.db # consistent, safe while serving$ loadbearer-fleet forget PC-01 # retire a decommissioned machine
The folder stays the source of truth and the index is derived, so rescanning is
idempotent — every run is keyed by the SHA-256 of the document it came from.
loadbearer-fleet reads the schema-tagged JSON rather than linking
loadbearer as a library, which is why the two release independently.